Case study · SaaS
Turning a reporting bottleneck into a self-serve analytics product
Two analysts were spending most of their week building customer reports by hand. We shipped a self-serve layer and gave them their week back.
- Client
- B2B SaaS scale-up
- Industry
- SaaS
- Region
- Singapore & Australia
- Duration
- 5 months
- Team
- 4 engineers
- Delivered
- 2025
The problem
Every customer report was assembled manually from three systems, which capped the company at roughly forty reports a month.
Enterprise prospects were asking for analytics in sales calls, and the answer was a spreadsheet emailed a week later.
The production database was being queried directly for reporting, causing latency spikes during business hours.
What we did
- 1
We built an ELT pipeline into a warehouse with modelled, tested and documented metrics, so a number means the same thing everywhere.
- 2
Reporting reads moved off production entirely, which removed the query contention that had been causing the spikes.
- 3
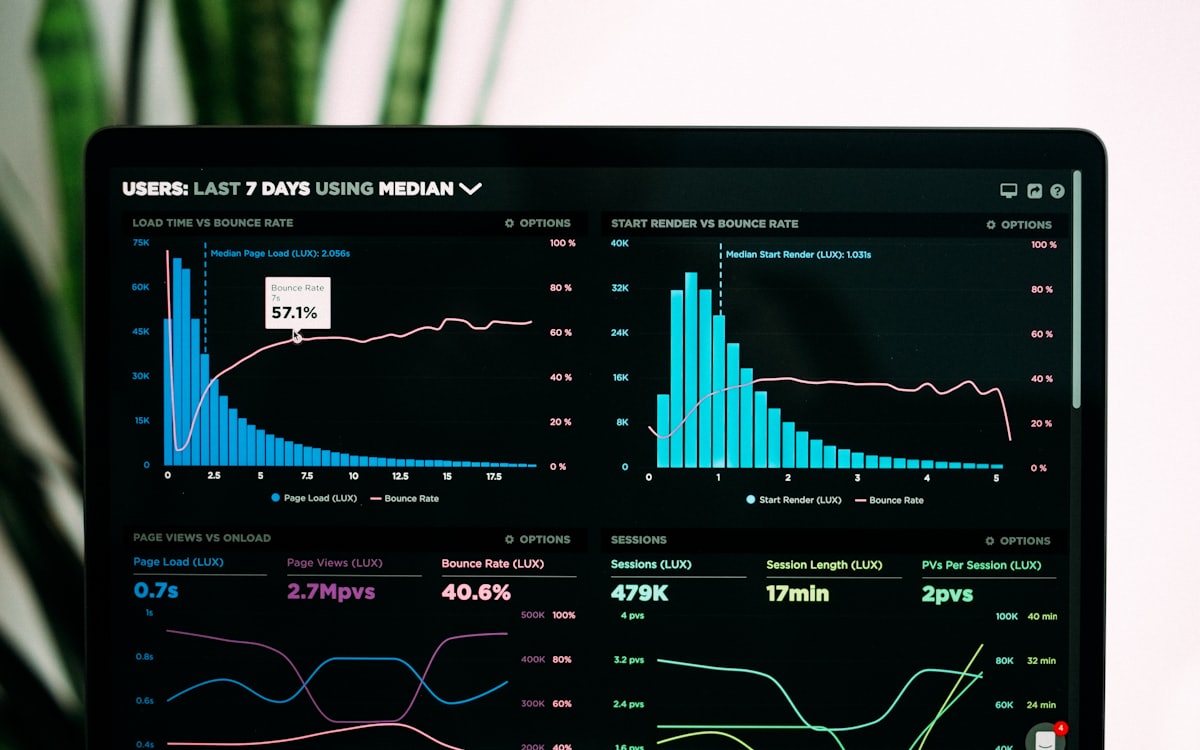
A self-serve dashboard lets customers filter, compare periods and schedule their own exports.
- 4
A natural-language query layer sits on top of the modelled metrics — constrained to the semantic layer, so it cannot invent a number.



Tell us what you need built
Send over the brief, or just a rough description. We read every enquiry ourselves and reply within one working day, usually with questions before a price.